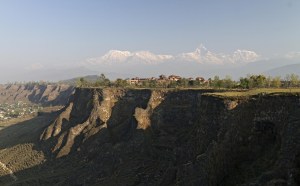
In 2018, we stayed at a much more modest place in Pokhara, but I wish that we had at least visited Fulbari.
It’s now facing foreclosure, a victim of the general economic difficulties in Nepal and recently of Covid-19.

In 2018, we stayed at a much more modest place in Pokhara, but I wish that we had at least visited Fulbari.
It’s now facing foreclosure, a victim of the general economic difficulties in Nepal and recently of Covid-19.
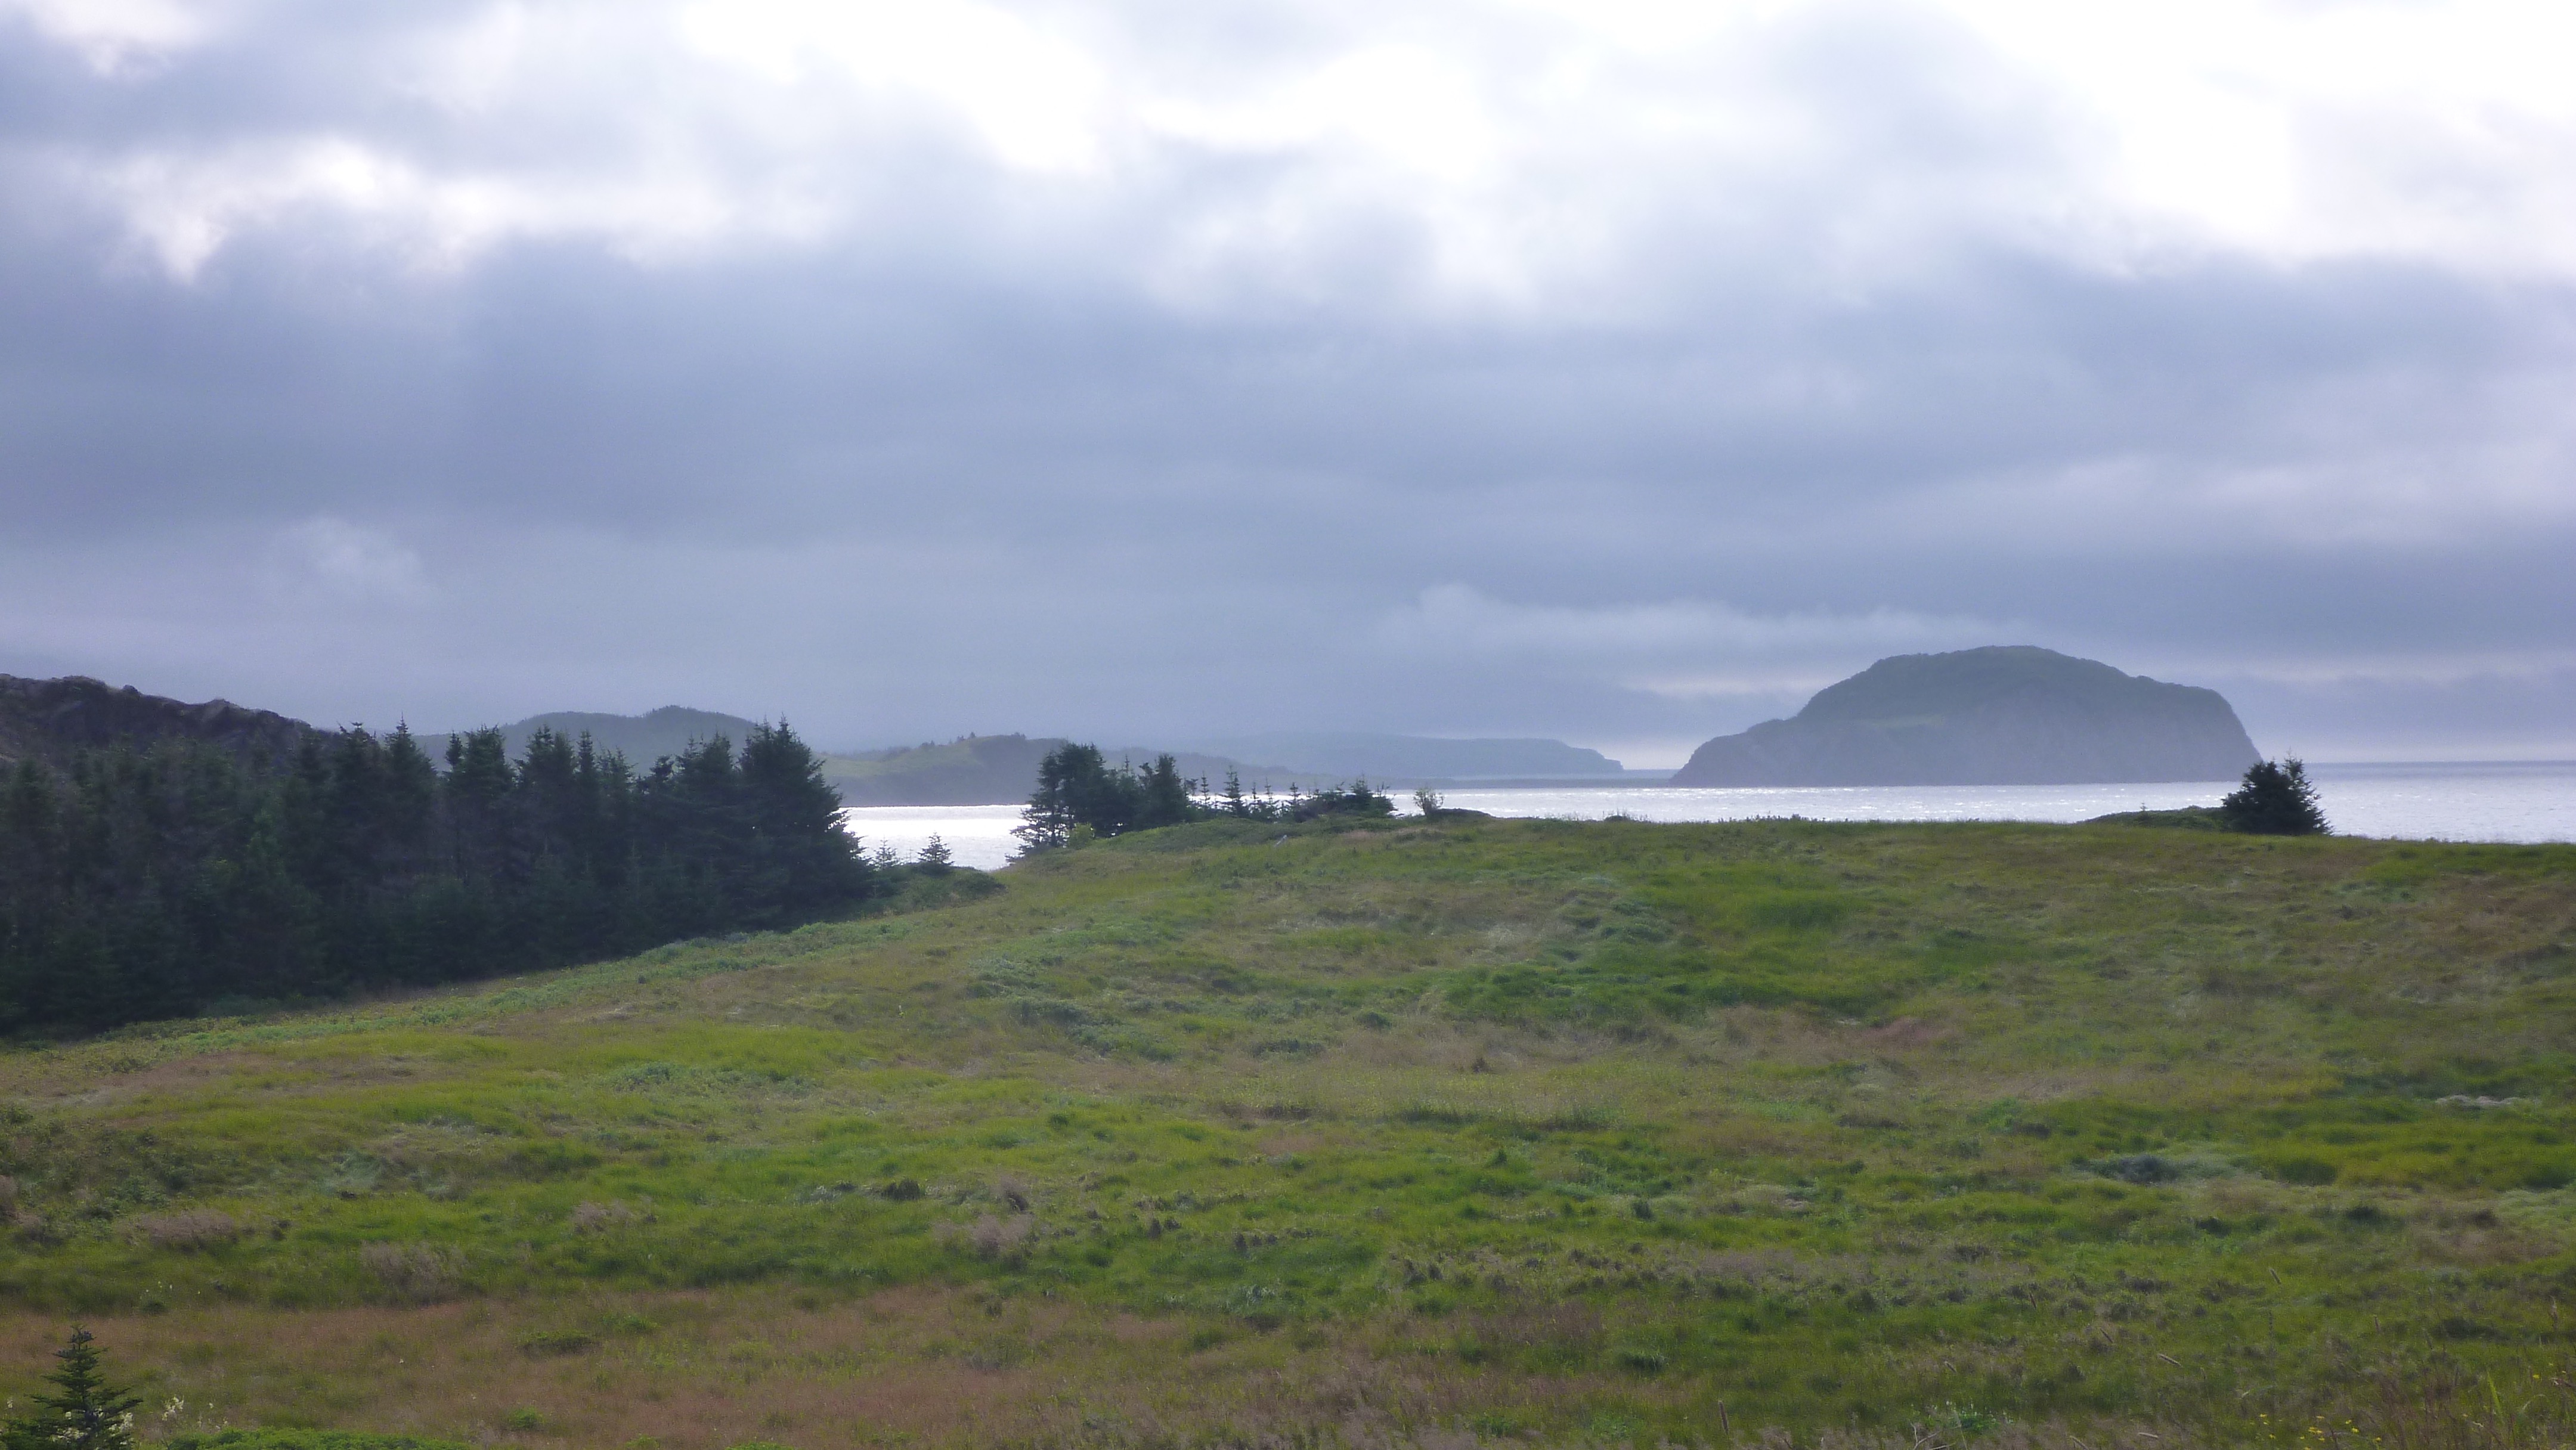
Devil’s Cove and beyond
There are similarities between Cape Cod (CC) and Newfoundland & Labrador (NL). Both are beautiful, have long histories connected with the sea, are more residential than industrial. Even details of the fishing are similar–cod, lobster, and shellfish. Many people remark that NL is like CC of fifty years ago.
One obvious difference is the impact of tourism. That’s very evident on CC, especially in July through August, until school resumes. Tourism is important in modern NL, too, but it’s less intense and more spread out.
I did some calculations, which showCape Cod’s well-deserved appeal draw for visitors. They also show why Newfoundland & Labrador appeals to those who seek a place away from population centers, including centers created by lots of visitors.
My data are not ideal. They’re from different sources and years as well as being incomplete on points such as length of stay. One could argue about whether Labrador ought to be included in this kind of comparison.
Nevertheless, the larger story seems clear. It explains why life is much calmer in NL than on CC, especially in August
visitors/year – 5.23 M
area – 339 mi²
visitors/year/area – 15,428
visitors/year – .50 M
area – 156,453 mi²
visitors/year/area – 3
NL area / CC area – 462
NL visitor density / CC visitor density .0002
The reciprocal of the last figure says that there are nearly 5000 CC visitors in a given area for a single NL visitor.
It’s only fair to mention that I haven’t been to Signal Hill in St. John’s yet. I expect that it may present a different picture from the tiny outport communities.
